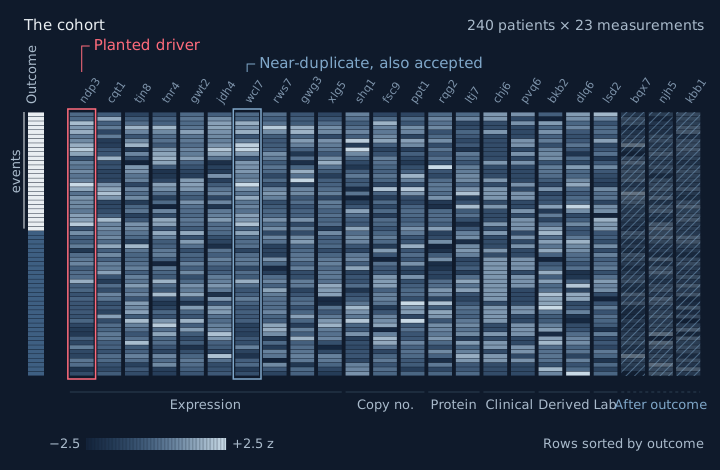
Benchmark worlds preserve the correlations in real cancer cohorts. This one has 240 patients and 23 measurements.
Can an agent find the signal—and know when there is none?
Here is a cohort with an outcome. Which measurements drive it? Return an ordered list, most likely first, or an empty list if nothing can be found.
Cubes: each patient's level of each candidate biomarker · Towers: how strongly each biomarker tracks the outcome

Why this task
Biomarker discovery produces many promising associations and few clinical tools. Poor methods, selective reporting and failed validation are recurring problems12. Four failures recur:
- a correlate mistaken for a cause;
- a confounder that lifts many measurements at once;
- a variable measured after the outcome, which "predicts" it trivially;
- a confident claim where the data support none.
ONC-AGI plants known mechanisms in cohort data, turning each failure into a test with a checkable answer. An agent that passes does the work of a careful biostatistician: it finds the cause, not its correlates, and says nothing when nothing is there.
Try one
A world from the benchmark's training set: 240 patients and 23 measurements. Each patient costs $108 with every assay. Buy patients, read the evidence, then name what drives the outcome, most likely first, or nothing.
-
Buy patients
$25,920 to spend; the reference study costs $17,280.
-
List what drives the outcome
Click the bars to add measurements, in order. Click again to remove one.
Evidence, −log10 p
Buy patients to see the evidence.
Follow one discovery
240 patients. 23 measurements. A fixed budget.
Training worldsequential access
Patients available240 · $40 each to recruit
Budget$25,920
Measurements · assay price per patient
Expressionndp3$2cqt1$2tjn8$2tnr4$2gwt2$2jdh4$2wcl7$2rws7$2gwg3$2xlg5$2
Copy no.shq1$3fsc9$3ppt1$3
Proteinrqg2$8ltj7$8
Clinicalchj6$0.5pvq6$0.5
Derivedbkb2$1dlq6$1
Lablsd2$5
After outcomebqx7$5njh5$5kbb1$5
Submitan ordered list, or nothing
Answer keyheld by the scorer
1 · Build a world
ndp3 drives the outcome. Its near-duplicate, wcl7, carries almost the same information. The task accepts either.
Generate an outcome from the planted mechanism. The signal is known; which patients experience the outcome remains noisy.
3 measurements are taken after the outcome. Such variables can leak the answer. Feature names are masked so the agent must work from the data.
2 · Check what can be found
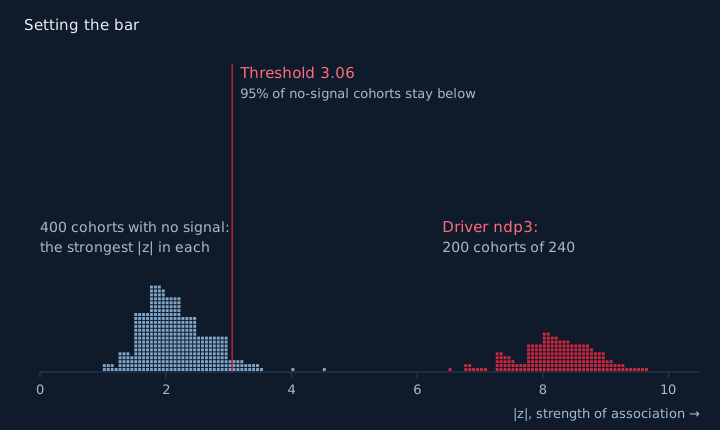
Redraw the outcome hundreds of times to check whether the planted signal can be detected. Here the driver is detected reliably, in at least 80% of cohorts even at the lower end of its 95% interval, from about 60 patients; an unrelated measurement almost never is.
The bar comes from worlds with no signal: the strength of association that 95% of them never reach. When the data cannot tell a measurement from the driver, it is accepted as equivalent.
3 · Give the agent the task
The agent receives:
- how many patients exist;
- every measurement, with its kind and whether it was taken after the outcome;
- the price of recruiting a patient and of each assay;
- a budget.
The interface withholds the answer. The agent buys data before analysing it.
4 · Acquire evidence
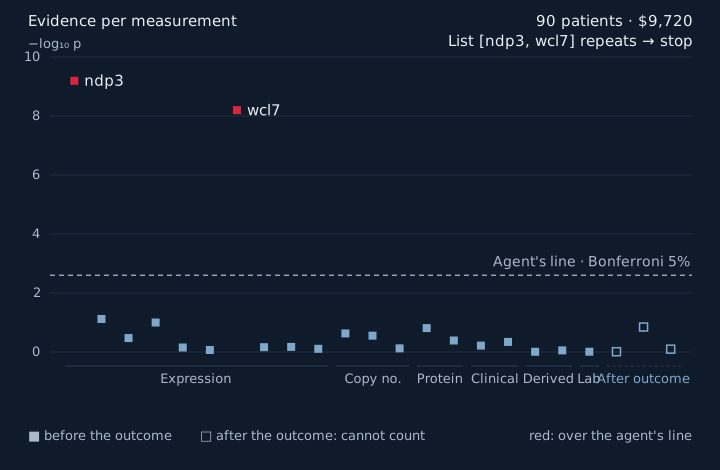
This baseline recruits patients in batches and tests each measurement, correcting for multiple comparisons. Only measurements taken before the outcome can enter its answer.
At 30 patients and 3,240 USD, one measurement crosses its threshold.
At twice the sample size, the near-duplicate crosses too. More evidence supports the signal without separating the two measurements.
At 90 patients, the list repeats. The baseline stops and submits [ndp3, wcl7], spending 9,720 of 25,920 USD.
5 · Score the answer
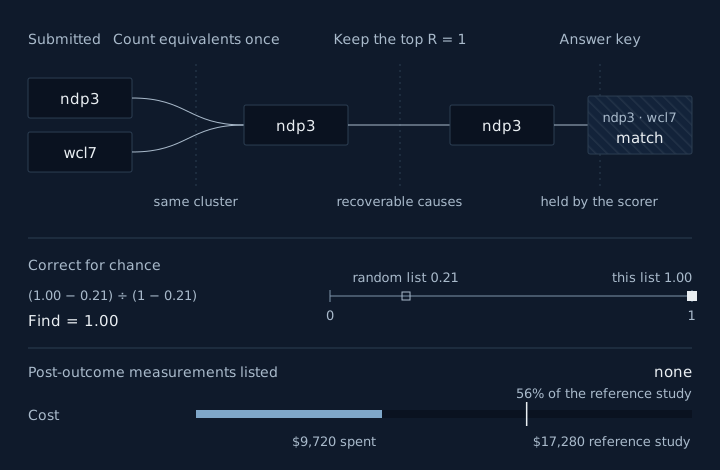
The scorer counts equivalent measurements once, then keeps only the first R: the number of recoverable causes, one here.
Either twin matches the key. Credit is corrected for what a random list of the same kinds of measurement would recover.
A post-outcome measurement invalidates the answer. Acquisition cost is compared with the 17,280 USD reference study; this run costs less and keeps its full credit.
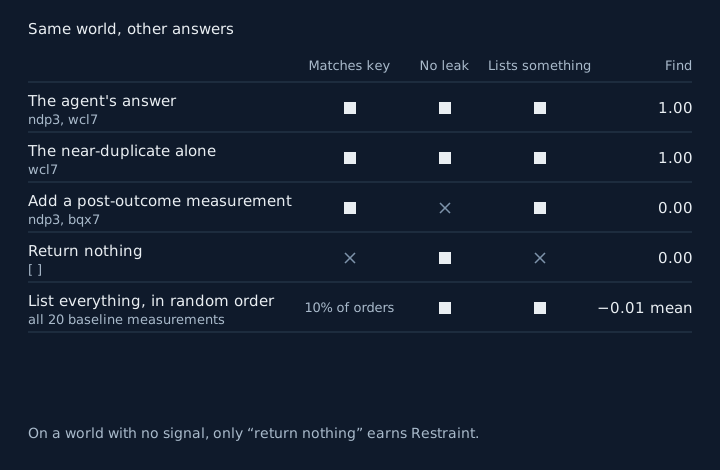
The same scorer, run on other answers: the near-duplicate alone earns full credit; a post-outcome measurement removes it; silence misses this signal; listing everything depends on a lucky order.
Across many worlds, a fifth with no signal at all, the headline is Discovery Score = Find × Restraint. Restraint rewards returning nothing when there is nothing, so always answering, never answering, guessing and padding all score zero.
Figures as editable SVG: Cohort Detection Threshold Evidence Scoring Other answers

What makes it hard
Each mechanism is built so that a common shortcut fails. Six of them, shortcut against analysis:
Respect time
A measurement taken after the outcome tracks it closely.
Hollow bars were measured after the outcome: they cannot count, even above the line.
- Shortcut
- Rank everything by association: lxh7 comes first, a leak, so Find falls to 0.
- Analysis
- Rank only what was measured before the outcome: sjr2, Find 1.
Separate cause from confounding
A clinical subtype raises risk and lifts five genes.
Dashed outlines: each gene with the subtype ignored. Solid bars: compared within each subtype.
- Shortcut
- Screen genes on their own: g4, g2, g3 lead, all lifted by the subtype.
- Analysis
- Compare within each subtype: only x7 remains.
Look for joint effects
The outcome follows two measurements together; neither matters alone.
- Shortcut
- Screen one measurement at a time: nothing crosses the line.
- Analysis
- Test the pair jointly: a1 × a2 stands far above it.
Look across data types
A copy-number change drives the outcome and switches on a gene.
- Shortcut
- Read only gene expression: e1, the gene it switches on.
- Analysis
- Read every data type: c1, the copy-number cause.
Respect how the data were pooled
Two batches differ in both marker level and event rate.
- Shortcut
- Pool the batches: the marker looks protective.
- Analysis
- Compare within each batch: it raises risk in both.
Know when there is nothing
A twin of a real world with every effect removed.
Hollow bars were measured after the outcome.
- Shortcut
- Always name the strongest measurement: jhz8, a false claim.
- Analysis
- Nothing crosses the line, so return nothing: the only answer that earns Restraint.
The benchmark also plants near-duplicates that count as one answer, hidden causes seen only through proxies, modules of genes acting together, mediators and colliders, and sequential worlds where every patient and assay costs money.
What a score means
- The agent recovered planted mechanisms in real correlation structure, against an oracle certificate, more often than chance.
- It said "nothing" when nothing was there, and paid for data in proportion to the question.
- The agent interface withholds the key. Public training answers remain available to developers.
Run your agent
Bring a method or an agent. Read the world card, choose actions, and submit an ordered list through the public engine.
Needs Python 3.12 and uv. The smoke test takes about ten seconds.
Or use the hosted ONC-AGI Arena: sign in with GitHub, bring a model or upload an agent, and see verified results on the live leaderboard.
git clone https://github.com/BradSegal/ONC-AGI && cd ONC-AGI
uv sync
uv run onc-agi smoke
Expected outputsmoke passed
ONC-AGI smoke - 20 public-train worlds
oracle             DS  1.000  [+1.00,+1.00]  Find  1.00  Restraint +1.00  Strict  1.00  Leak 0.00
univariate_bh      DS  0.511  [+0.29,+0.75]  Find  0.72  Restraint +0.71  Strict  0.51  Leak 0.00
seq_univariate_bh  DS  0.578  [+0.35,+0.84]  Find  0.82  Restraint +0.71  Strict  0.58  Leak 0.00
stability          DS  0.407  [+0.21,+0.65]  Find  0.63  Restraint +0.65  Strict  0.41  Leak 0.00
random             DS  0.000  [-0.00,+0.00]  Find  0.00  Restraint +0.00  Strict  0.00  Leak 0.00
giant_list         DS  0.000  [-0.00,+0.00]  Find  0.00  Restraint +0.00  Strict  0.00  Leak 1.00
always_empty       DS  0.000  [+0.00,+0.00]  Find  0.00  Restraint -0.17  Strict  0.00  Leak 0.00
leak_exploiter     DS  0.000  [+0.00,+0.00]  Find  0.00  Restraint +0.00  Strict  0.00  Leak 1.00
random_abstain     DS  0.000  [-0.08,+0.00]  Find  0.08  Restraint -0.40  Strict  0.00  Leak 0.00
smoke passed